The road trip is a cultural rite of passage in the US, and there’s countless ways to organize your path across the country. You can follow a famous road, Route 66 through the west, the Pacific Coast Highway, or Route 20 across the north. You can chase a theme, following the Blues highway, or just blue highways, the minor roads that criss-cross the rural parts of the nation. You can seek out the best BBQ, or follow the tamale trail.
Me? I like to start a trip with a data set.
I’m interested in why people live where they live, and a major component of that question is “where can I afford to buy or rent a house?” There’s a simple statistic that summarizes whether a housing market is relatively affordable: the average years of median income required to by a median home. Because both aspects of the ratio are calculated locally, it helps balance questions of how lucrative employment is with differences in local costs of living. Throughout the 1990s, this ratio averaged 3.2 across the US. In 2022, it peaked at 5.1 – in other words, it would require more than five years of median salary to buy a median home. The ratio is down slightly now to 4.9, but it’s a massively different market for homebuyers now than when I bought my house in 1998.
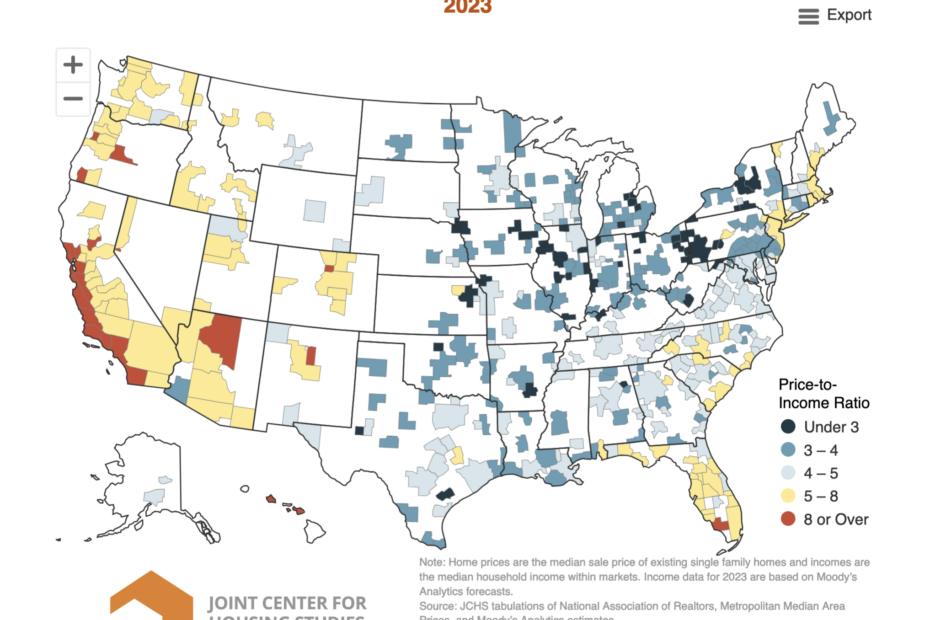
While home prices are up almost all across the nation, there’s enormous variation from one city to the next. And so the data set I’m planning my road trip around is from the 2024 State of the Nation’s Housing from the Joint Center for Housing Studies at Harvard.
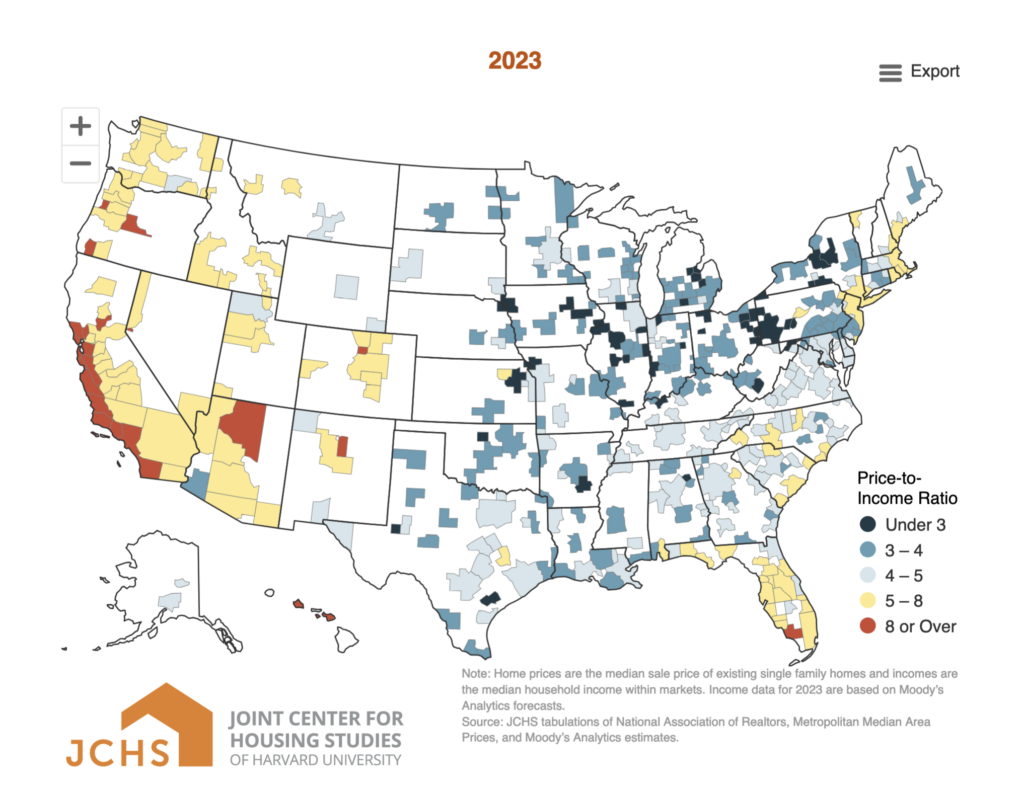
In the map above, yellow and red represent expensive housing markets, with price/income ratios of 5x or higher. Many of the major cities of the east and west coast are predictably high, with all of coastal California at 8x or over. But so are some of the growing cities of the mountain west, including Denver/Boulder, Salt Lake City and almost all of Arizona.
Now let’s look at the dark blue. With price/income ratios of under 3, these are the bargain cities. A very few of them are in states experiencing growth: Odessa, Texas has had boom and bust cycles around the oil industry, but it’s grown enormously in the past decade and yet is still cheap. But most of the dark blue is in the Midwest and upstate New York, the “rustbelt”, a part of American I’ve long been fascinated with.
Here’s what most interests me: many of the cities where houses are expensive are cities facing serious climate challenges. Consider Naples, Florida. It’s one of the most expensive MSAs (Metropolitan statistical areas – Census-speak for “a city and its environs”) with a price to income ratio of 9.4. But even if you can afford that house, perhaps you shouldn’t buy it. Naples has “extreme” risk for flooding, wind and heat, the highest level of risk in models developed by First Street Foundation, a company that models environmental risk for US properties.
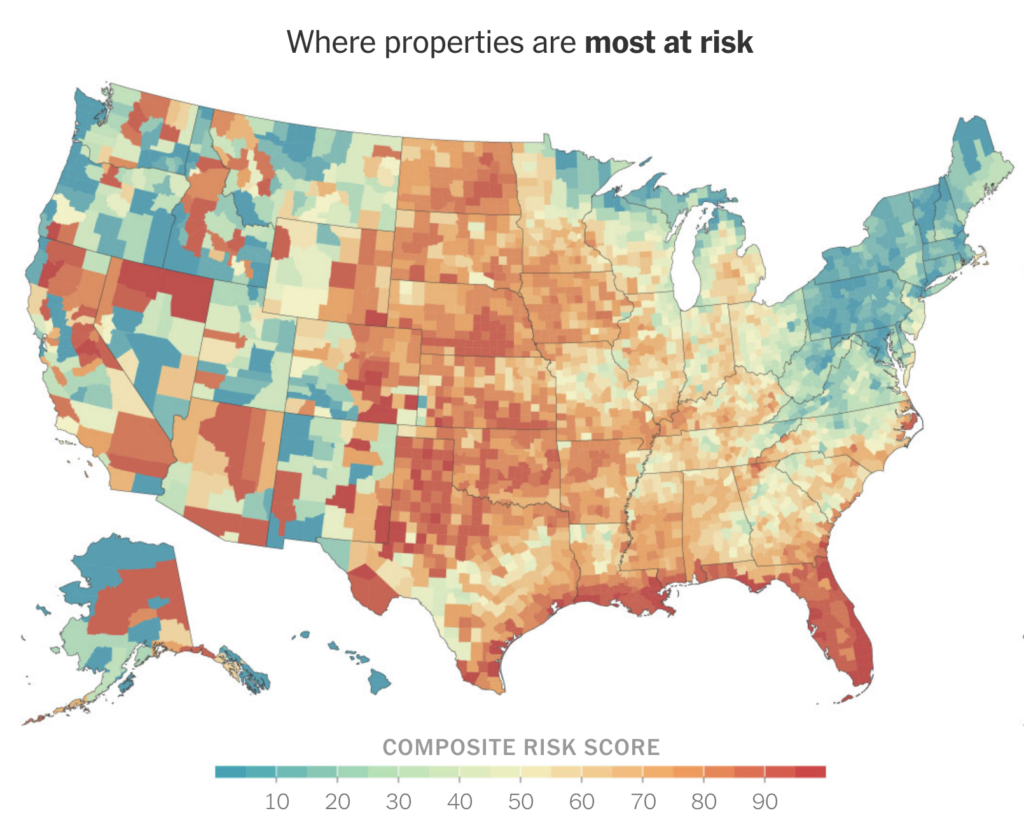
Composite risk map from NYTimes, generated using data from First Street Foundation. See https://www.nytimes.com/interactive/2024/07/08/climate/home-insurance-climate-change.html
By contrast, many of the most affordable cities are pretty climate resilient. Utica, NY – one of my favorite rustbelt cities – is a bargain at 2.8 price to income, and there’s a pretty good chance your house will survive the next few decades. Utica is at moderate risk of flooding, heat and fire (the third of six levels on First Street’s scale), minor risk for wind damage and air quality. And unlike in Florida, there’s a decent chance you can afford to insure your home.
Many of these climate resilient, high affordability cities are shrinking while more expensive and climate fragile cities are growing. There’s a long, complex story behind that which includes not only deindustrialization but also a campaign around the idea of “growth cities”, cities with low taxes, low services and right to work laws, designed to limit the power of unions. (Barry Goldwater comes into it, too.) But that’s a book chapter, not a blog post.
Why are these cities so inexpensive? Why are some of them shrinking? There’s a simple, straightforward hypothesis – maybe these just aren’t very good places to live. But I’ve been to several of the cities that rank high on this list and I like them a lot. Indeed, I live in a city that’s well below the median in terms of price to income ration – the Pittsfield, MA area is 3.9, the second least expensive in New England. (We come in just behind Bangor, ME, which is also a really lovely little city.) It’s a great place to live.
Gateway cities map, from Brookings Institution report, 2007
In 2007, Massachusetts was trying to figure out what to do about cities like mine, who were falling well behind Boston in the state’s “Massachusetts Miracle”, a comparatively rapid transition from manufacturing to “knowledge-based” industries like tech and pharma. Cities like Pittsfield, Worcester and Lowell lost jobs as Boston gained them, and while these mid-sized cities had 15% of the state’s population, they had 30% of the state’s people living below the poverty line.
A study conducted by the Brookings Institution suggested thinking of these cities as gateways into America for new citizens. Maybe someone who’s just come to the US won’t stay in Pittsfield forever, but it’s a great place to find an inexpensive place to live, to learn English, to build up some work experience. Lawrence, MA has been entirely transformed by immigration – the former mill town is now 82% Hispanic, 43% foreign born, New England’s first “majority minority” city. It has not always been an easy road – there was racial violence in the city in 1984 between Spanish and English-speaking residents. But Lawrence is growing, the mayor and the majority of City Council are hispanic and the city exemplifies its long history as an immigrant city. Could these affordable, climactically-sustainable cities become gateway cities, welcoming migrants who’ve been forced to leave their countries due to climate change?
I’ll write more about gateway cities as I travel. The concept is both compelling and problematic – it’s not clear that the cities identified have been more appealing to immigrants than large, job-rich cities like Boston. And early data suggests that gateway cities in MA haven’t been as successful in helping families escape poverty as Boston… though MA in general is much better than most American cities in helping people escape poverty.
So one of the other questions I’ll be asking on this trip is whether the cities I’m visiting are good ones for immigrants. Sometimes it’s pretty easy to make guesses from numbers. Utica, NY has developed a reputation for a population rebound based on immigration, particularly Muslim immigrants from the Balkans, the Middle East and now Myanmar. While 13.7% of the people living in the US were born in another country, those immigrant populations tend to cluster in large cities where there are neighborhoods with familiar foods and people who speak the same language – Miami’s population is 57.9% foreign-born, New York City is 36.3%, LA is 36%, Houston is 28.9%. So when you see a small city (Utica’s population is about 64,000) with 22.2% foreign born population, something interesting is going on. I’ll be looking for cities that have already attracted immigrant populations and looking for signs of their impact on the cities, particularly via restaurants and grocery stores, my favorite paths into exploring a city.
So where am I going? Some – though probably not all – of the following cities:
#10 Binghamton, NY
#22 Elmira/Corning, NY
#19 Youngstown, OH
#30 Akron, OH
#27 Canton OH
#33 Lima, OH
#9 Terre Haute, IN
#1 Decatur, IL
#4 Springfield, IL
#3 Peoria, IL
#12 Davenport, IA
#11 Rockford, IL
#44 Michigan City, IN
#24 Battle Creek, MI
#31 Toledo, OH
#40 Erie, PA
#41 Syracuse, NY
#29 Rome/Utica, NY
Those rankings are by median home price/income ratios – Decatur, IL is the only American MSA under 2x, with a 1.9x. The census puts median monthly home ownership costs, which include mortgage payment, real estate taxes and utilities at $1,112 ($1,828 is the median across the country.) Central Illinois leads the nation in cheap housing, with Peoria and Springfield also in the top 5. (Danville, IL is #2, but slightly outside the loop I currently have planned.)
I’m making detours to see friends in St. Louis, Bloomington and Cleveland, and to see art and architecture… but some of the art I most enjoy is in cities within the dataset criteria. I’ve already made detours on other roadtrips to see the absurdly wonderful collection of mid-century American paintings at the Swope Art Museum in Terre Haute, the ambitious and forward-looking shows at the Figge in Davenport, IA and the world-leading glass museum in Corning, NY.
So I know for a fact that some of the towns on this list are cool places where I’d enjoy spending more time, and possibly relocating to. I’m hoping the trip – which will necessarily be impressionistic, too brief in any city to get more than an initial feel for a place – will help give me some insights into what’s holding these places back, what problems they might have in common.
I’m a planner, as you might have gathered from an itinerary governed by spreadsheets. But I’m trying to approach this trip with more flexibility than I usually give myself, in part because if I try to reach all these cities in the time I have (about ten days), I’ll make myself miserable. So – I’m going to Decatur, and several of the other cities above on the way. If you’ve got suggestions of things I should see or do in the cities listed above, or places nearby, please offer them up. And while suggestions are great, warnings are not – it’s my sense that a lot of the cities I’ve come to love (I’m looking at you, Cleveland!) are still shaking off the stereotypes of decades past. I’m less interested in whether it will play in Peoria than in what that city looks and feels like now.
I’m setting off on August 9 and will be posting regular updates here and on social media, mostly photos and reflections from the road, but some longer essays as well. Wave if you see a Toyota Prius with MA plates and the front bumper falling off.
This is a great trip. For city-refugee/ New Americans, check out IRC’s resettlement office locations that partially overlaps with your interests:
https://www.rescue.org/where-we-work
Following along :)
I would recommend Buffalo for your journey. A vibrant immigrant community with some interesting women cooperatives like Stitch Buffalo as well as a strong base of returning “ex-pats” doing interesting work in the arts (BICA, Annie DiFranco and many more). And some really interesting restaurants from the nearly 200 year old Schwabels (classic beef in wreck) to some great ethnic spots. Incredible theater scene and some very accessible and beautiful recreational opportunities with boating, x-country and downhill skiing right there.
When you visit my hometown Youngstown Ohio check out the Steel Museum, The Butler Museum of American Art, and terrific Mexican food at El Heje (just outside in Girard).
One economic question that I’m curious about is how (and how fast, and how much) working from home will effect domestic immigration patterns. I know people who left LA “temporarily” during the pandemic but never returned. Also curious how this will effect income (and income inequality), cultural diversity, and more.
….I’m surprised that in your second map so much of wintry Minnesota is red/orange and so much of New England is blue! Dependence on agriculture in MN, perhaps? The bluer, northwestern part of the state, and the cities of course, are not agricultural. The cities are more expensive, though. I would try to propose a Northwoods meetup near the Canadian border, but alas it’s a half day out of your way. Minneapolis, a very progressive city, is interesting because of its commitment to climate change adaptation–but still out of your way :(
One last thought: I’m glad to see that your definition of “Midwest” does not incorporate everything from western Pennsylvania to the Oklahoma panhandle. People from the coasts often lump into one category what are really multiple regions with distinct cultures, histories, and personalities. (Though I’ll admit it’s tough to name these categories, and we all disagree: Minnesota I think you can put simultaneously into the Great Lakes Region, the Upper Midwest, the Great Plains (the western part, at least), and of course “The Kingdom of the North.” Certainly the Starks live here!) Even within the state, the contrast–and ideological conflict–between the liberal northwestern “Iron Range” farmer-laborers (some are descendants of farmers who were forming cooperatives in the ’30s; FDR pinpointed them as the most likely source of a domestic communist uprising) and their more conservative brethren in the western part of the state is notable.
I look forward to following you. Do let me know if you decide to head further north.
Exactly the sorts of leads I need, Alex. Thank you.
I adore Buffalo and have made a few visits. It’s not on this particular itinerary because – oddly enough – it’s more expensive than a lot of the cities I’m visiting. I.e., it’s in the top 100 undervalued MSAs but not the top 50. But I may well stop in to get some Sudanese food at Nile Restaurant, a favorite of mine.
Pingback: Roadtrip: Side quest in Northern Ohio - Ethan Zuckerman
Pingback: Roadtrip: In search of the "statistically improbable restaurant" - Ethan Zuckerman
Pingback: Road trip: Peoria to Kankakee - Ethan Zuckerman
Pingback: Roadtrip: A tale of two cities - Ethan Zuckerman
Pingback: Road trip: The Company Town and the Corn Fields - Ethan Zuckerman